 “An infographic is 30 times more likely to be read than a purely textual article.” Alongside this, “People remember 80% of what they see and do, compared with just 20% of what they read.” (Search Engine Journal)
Based on the above, using an infographic in your marketing strategy sounds like a no brainer. But what is an infographic?! Well, it’s a good question, as not everyone is in the know!
An infographic is a visual representation of information or data. There you have it.
It turns out, more businesses are using visuals to tell their story and it’s no surprise, with 42% of marketers reporting their highest engagement comes from infographics over any other form of visual content. They are a perfect way to make it clear what you do, communicate your successes and engage your audience in an effective way, all in one neat & tidy package.
Ultimately, you want to communicate information about your business clearly and concisely. Displaying your achievements via a visual story can help explain to your audience at a glance, why they might want to be a part of what you do and how that could be beneficial to them.
By selecting key company information to showcase – whether figures, facts, stats or processes – and combining this with strong supporting imagery, you stand to increase engagement in a way that text alone simply cannot do.
Here’s some of our favourite infographic examples:
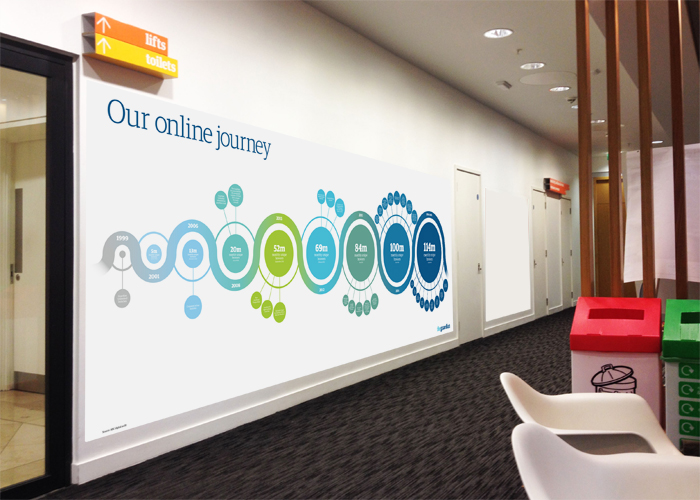
| Guardian: Timeline Wall Infographic |
 |
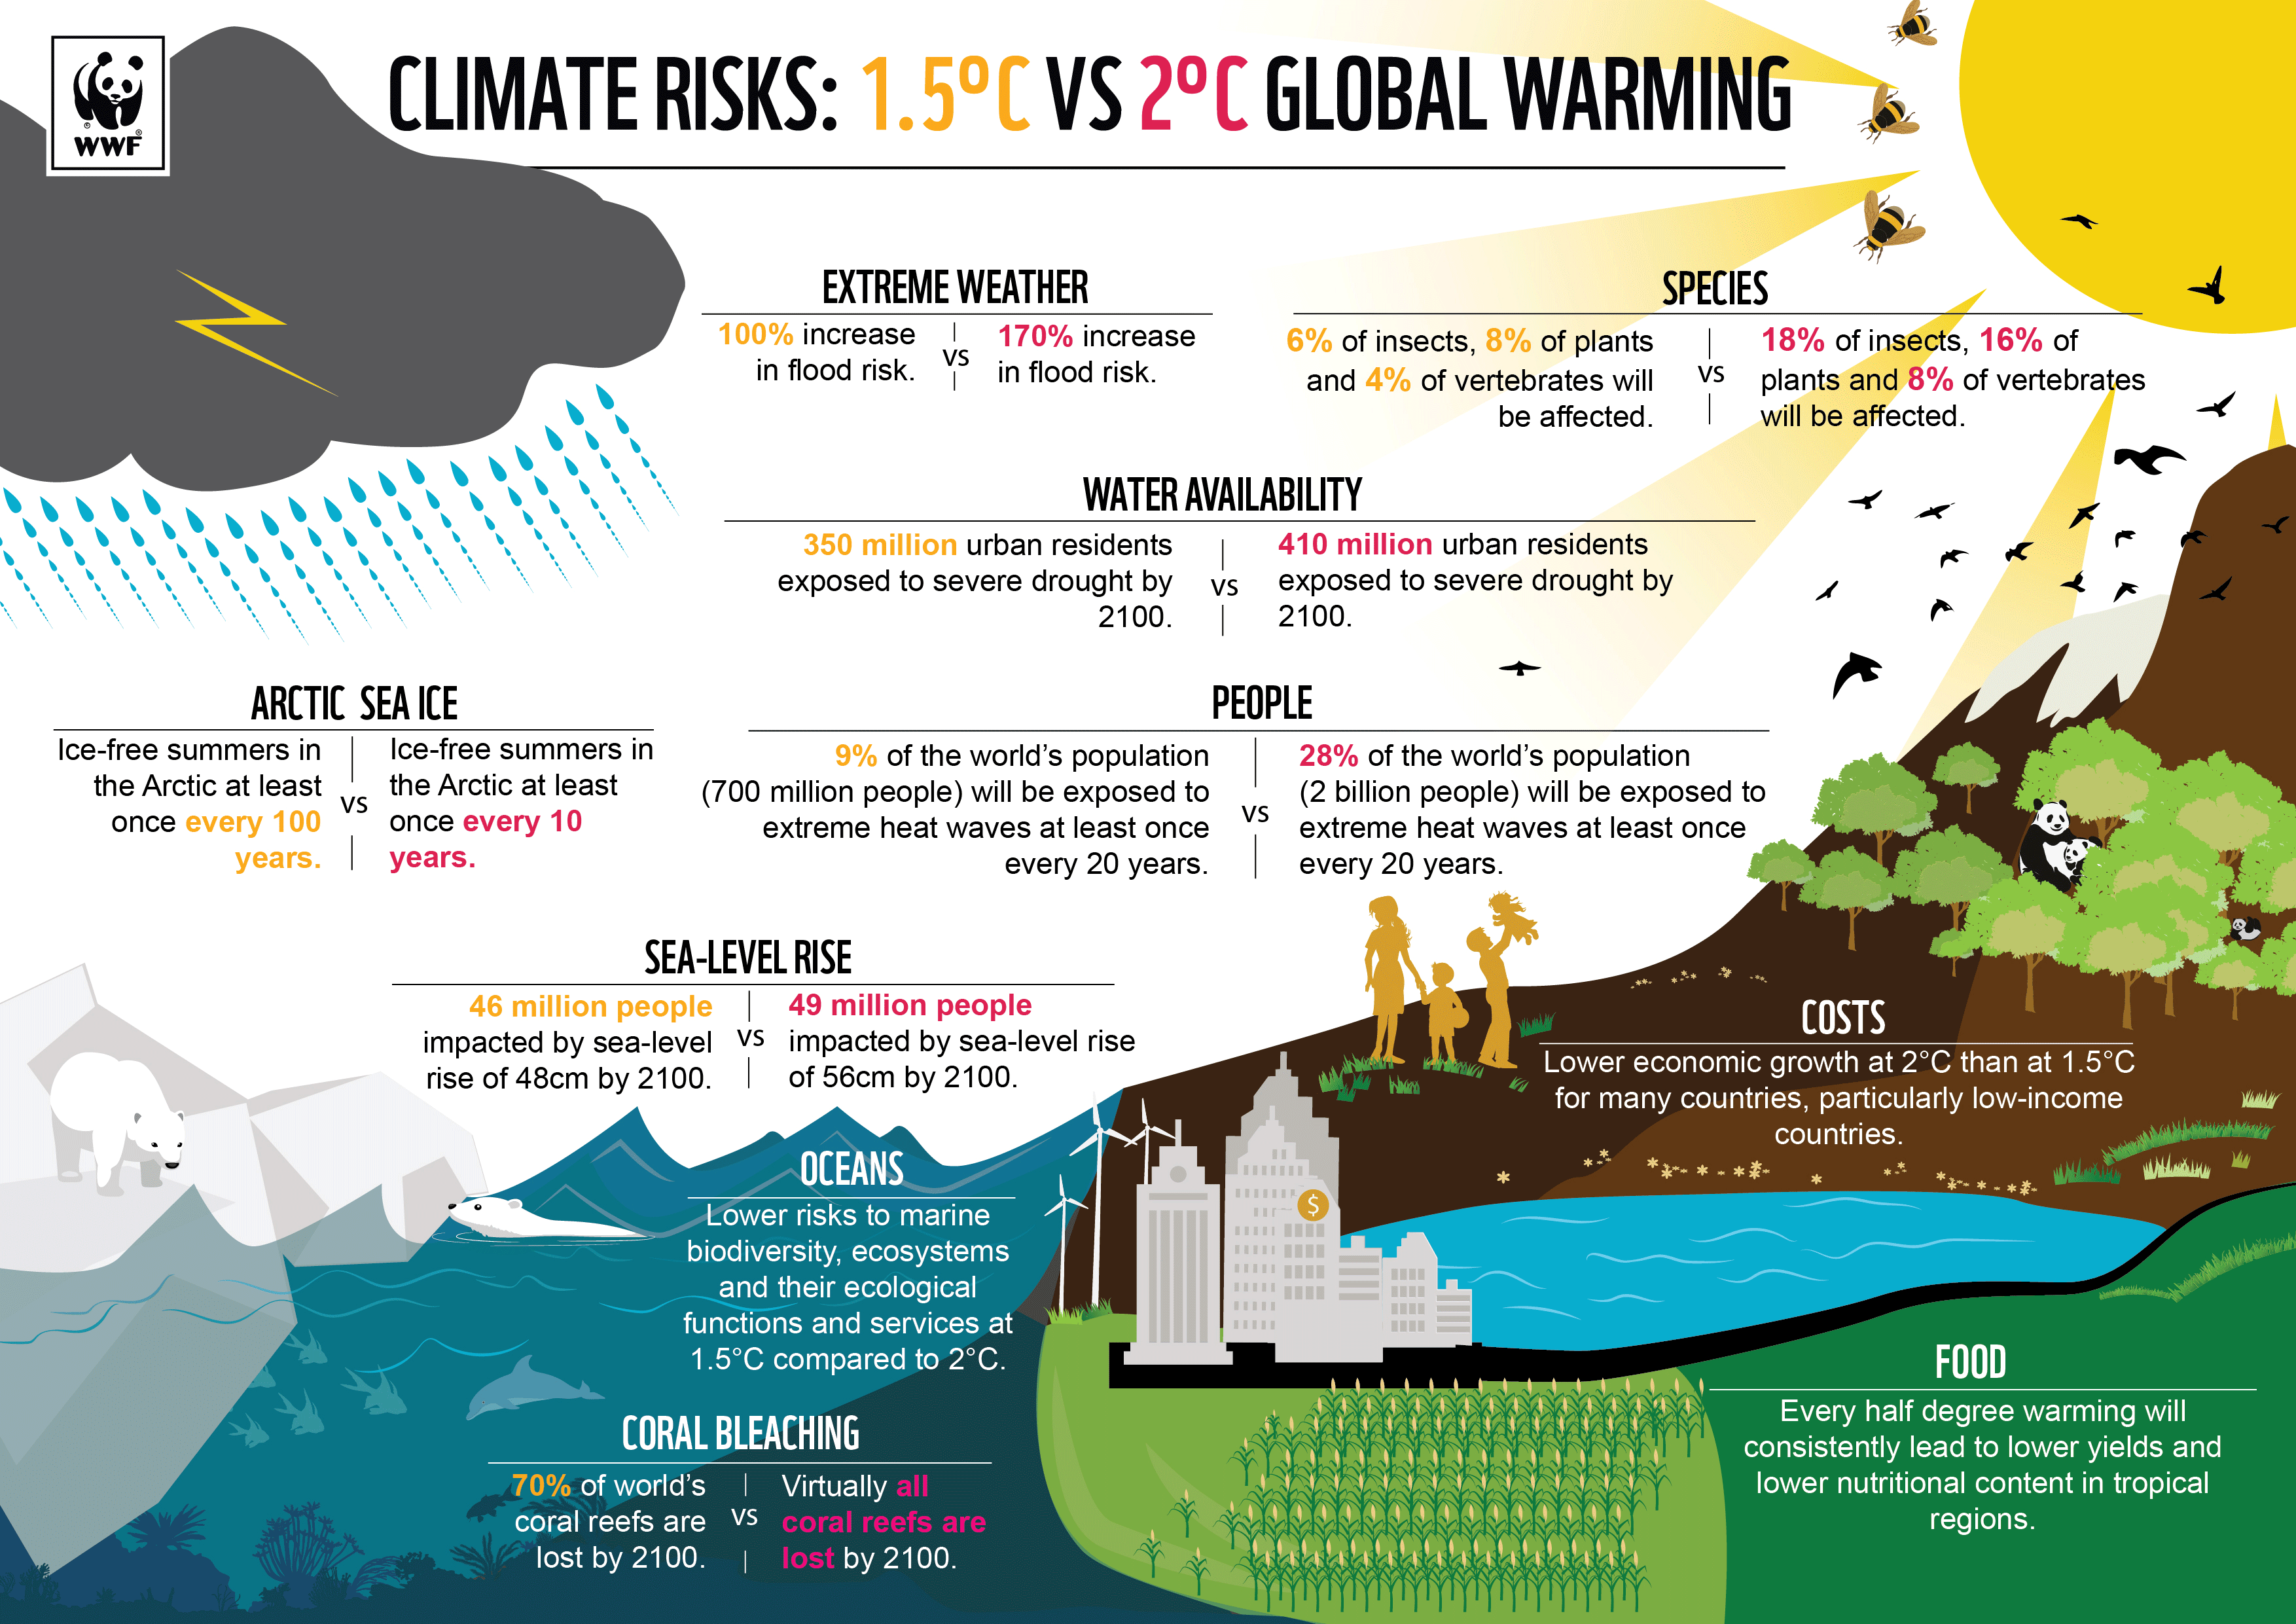
| WWF: Infographic for Awareness |
 |
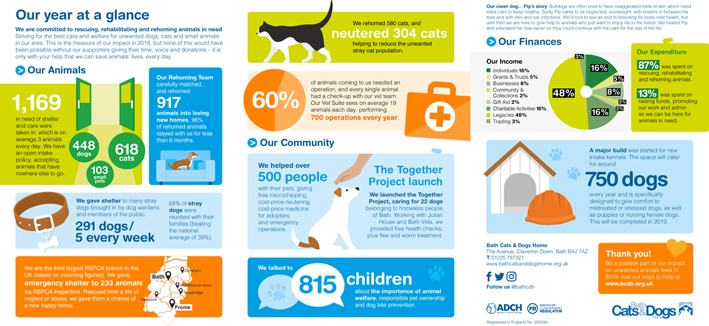
| Bath Cats & Dogs Home: Impact Report Infographic |
 |
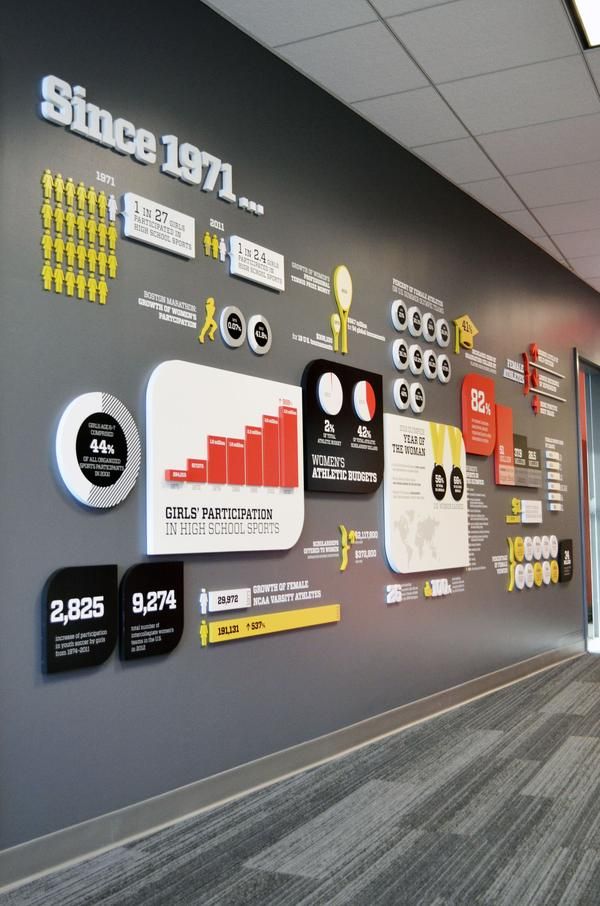
| ESPN: Wall Accent Infographic |
 |
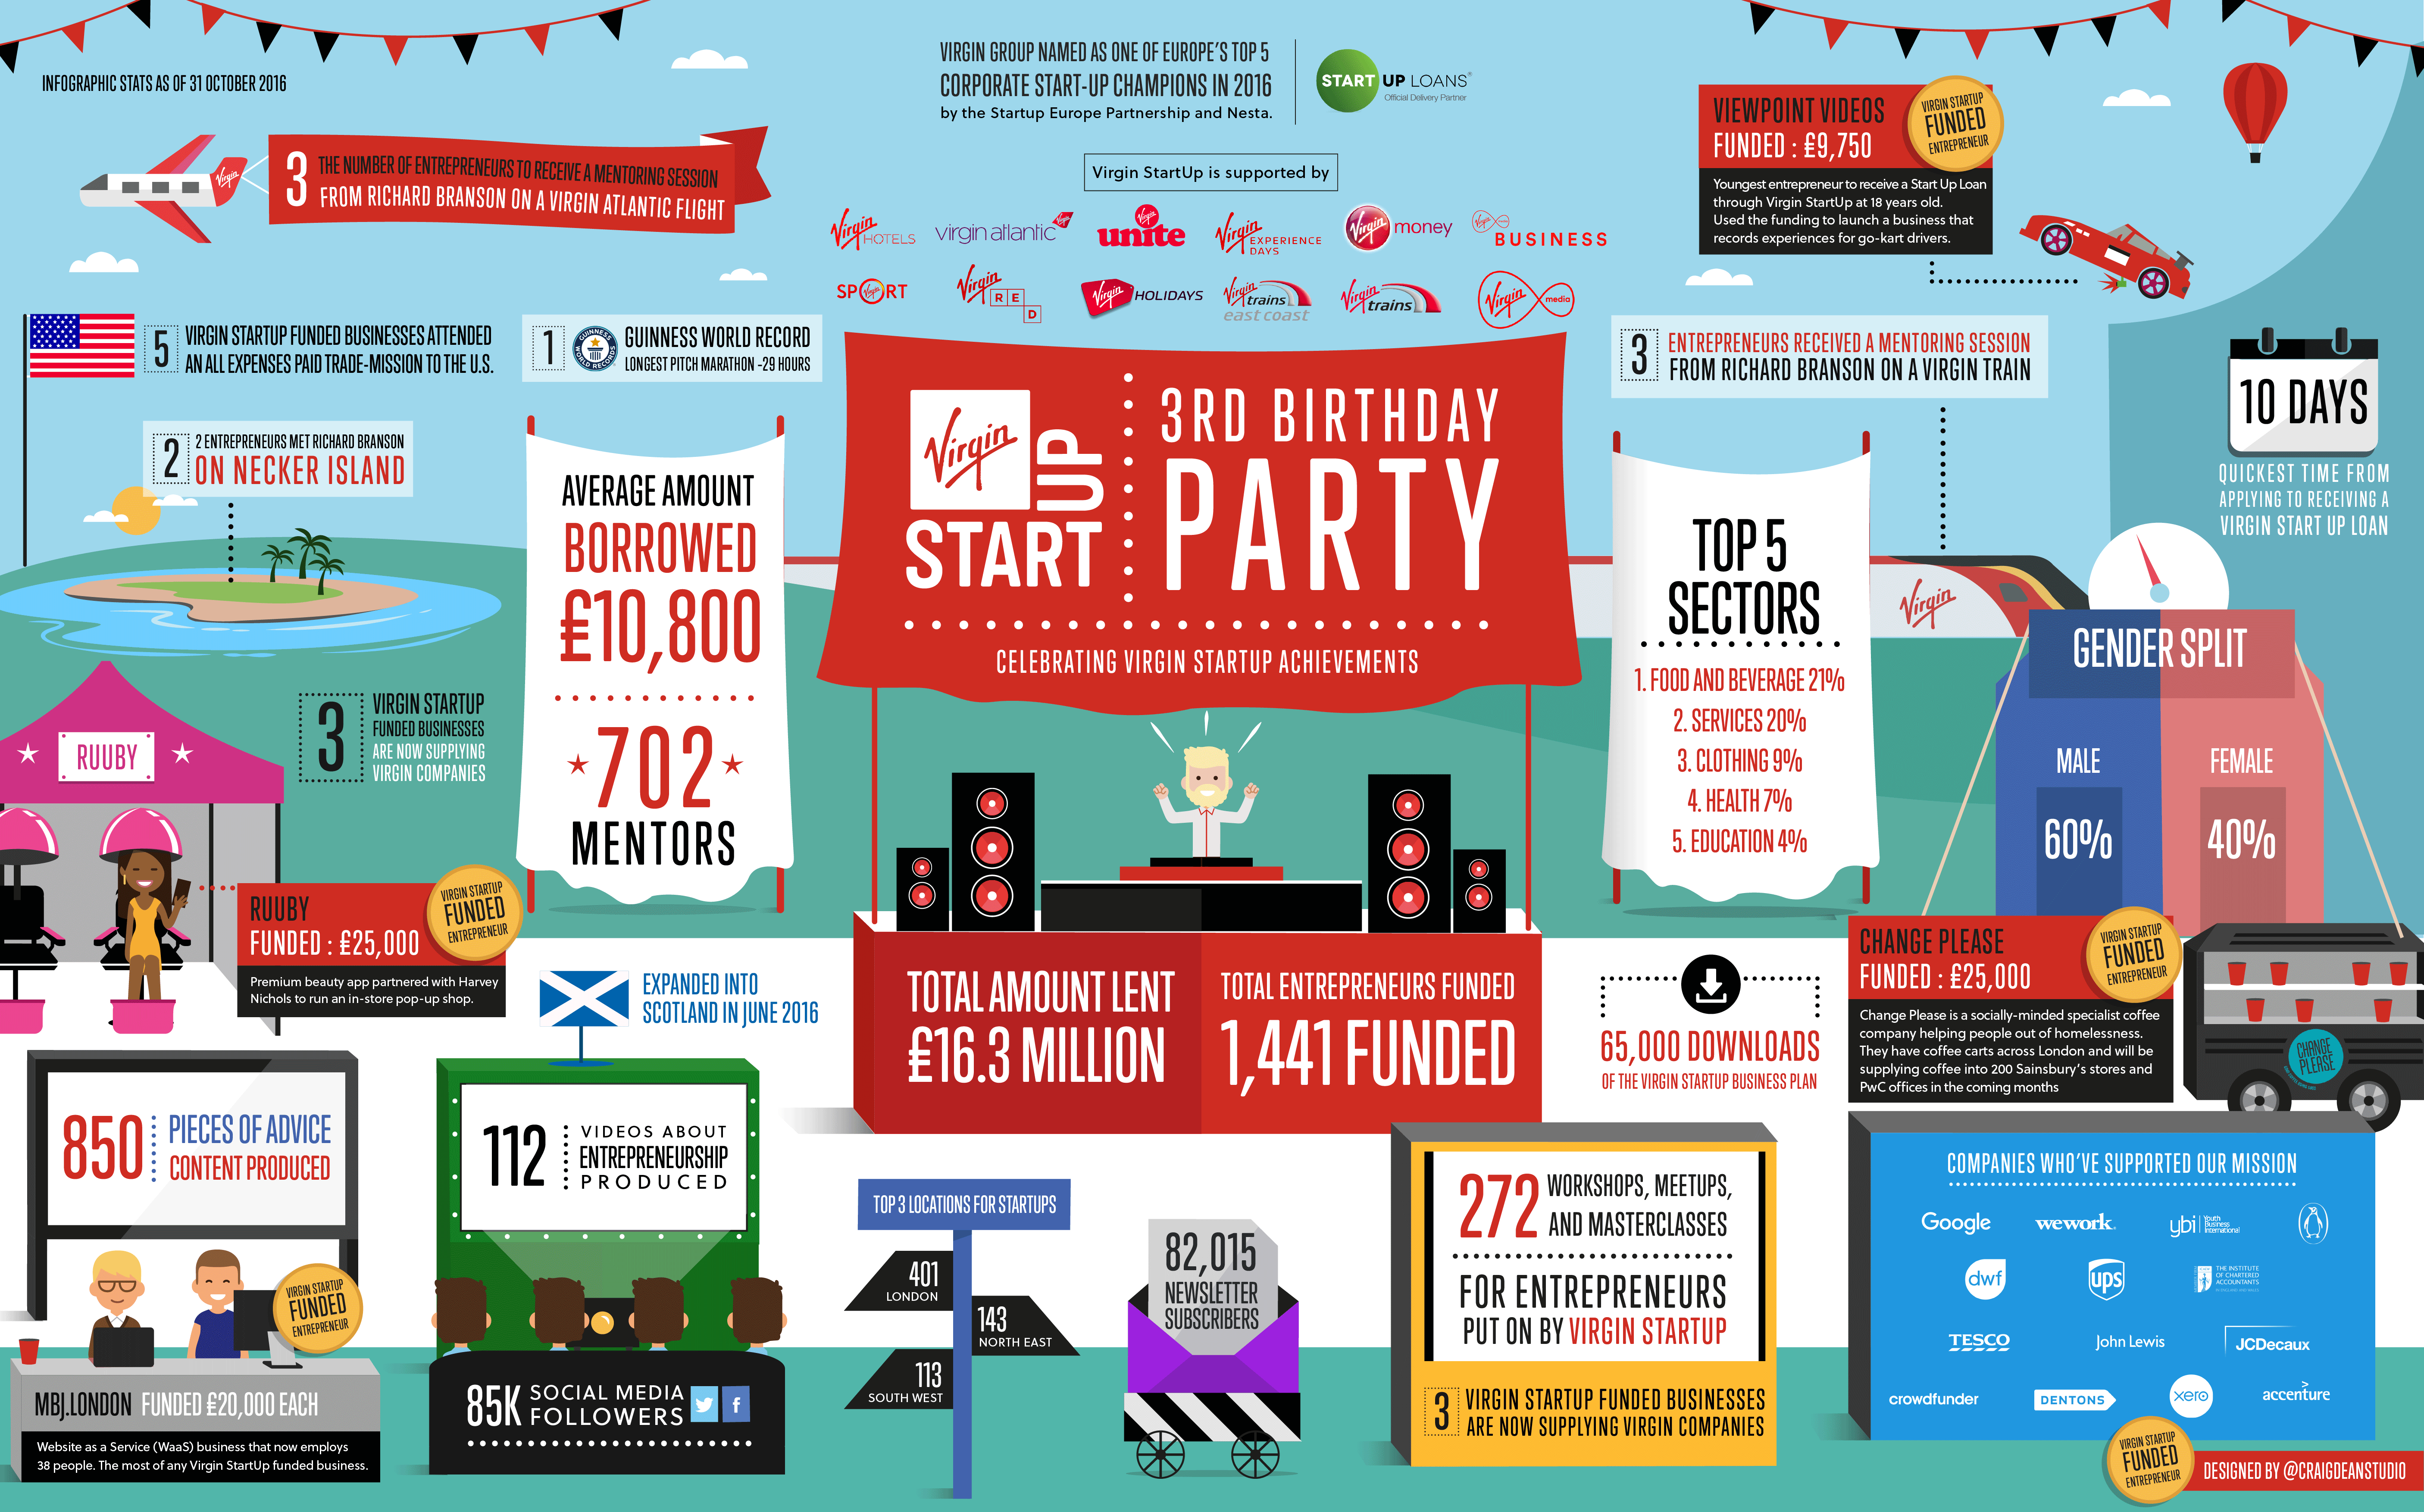
| Virgin: Event Promotion Infographic |
 |
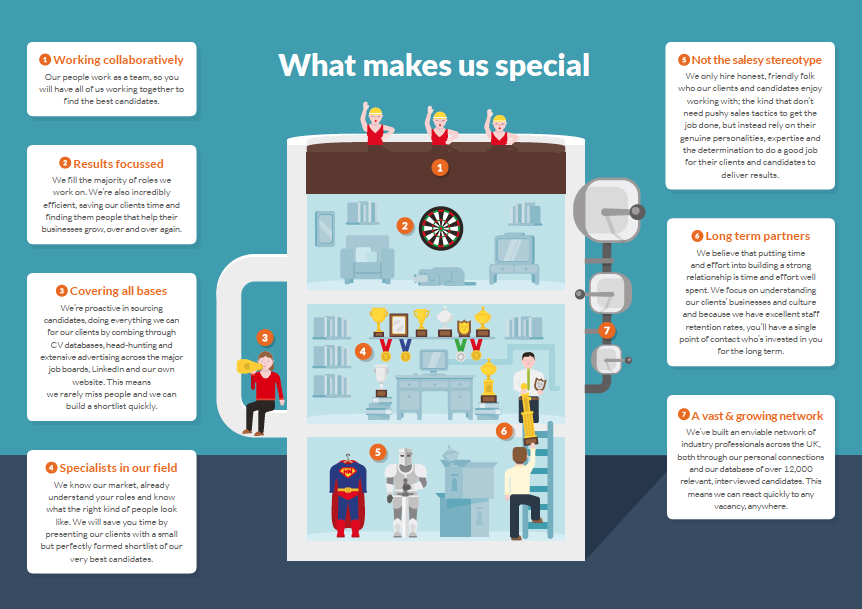
| Henry Nicholas: Value Proposition Interactive Infographic (one we made earlier) |
 |
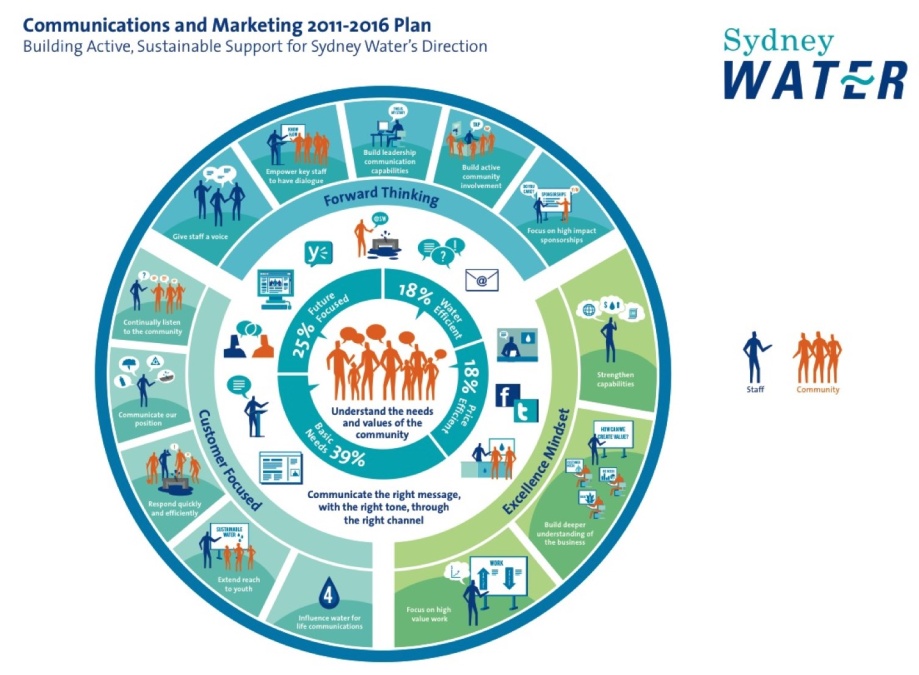
| Sydney Water: Strategy on a Page Infographic |
 |
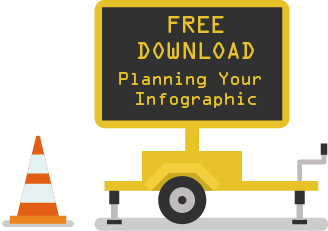
Planning Your Infographic
Making a start on collating key information might seem overwhelming, but focus on the reason you are doing it – adding value to your audience.
In essence, key stages when designing and sourcing content for your infographic are:
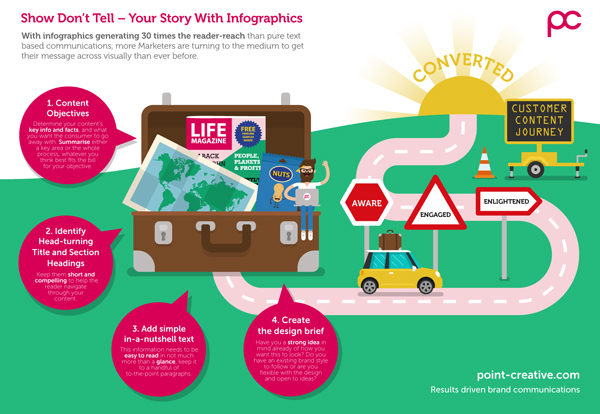
1. Plan Your Content Objectives
How will the content benefit your business and the reader? Does it need to educate, inspire, change perceptions? Determine the key points and facts, and what you want the audience to take away after engaging with it.
2. Identify Head-Turning Title and Section Headings
Keep them short and compelling to navigate the reader’s eye across the infographic. Section headings are useful to compartmentalise different content types within the design.
3. Add Simple In-a-Nutshell Text
This information needs to be easy to read in not much more than a glance, keep it to a handful of to-the-point paragraphs. Once written, review it to see if the text is absolutely essential or if graphical interpretation would be better suited.
4. Create the Design Brief
Now the fun begins! Have you a strong idea in mind of how you want this to look? Decide whether the design style is functional or a more adventurous creative concept. Source reference points of styles you like. Make notes of any initial design thoughts to support the content created. Write all this up in a neat design brief and you’re off!
We’ve created a handy infographic of the key steps for easy reference, download it here.
On another note, if you’re unsure how to nail a tip top design brief, see our blog post
If you’re not from a design background, visualising how this may look and work could feel a little daunting, but that’s where your design team comes in. So, don’t worry, as long as you have worked on the above key points and have come up with concise information for your graphic, all will be well.
Finally, if you’d like help with your next infographic project, get in touch!